Insights
The “Insights” tab shows how much the group spent, when and on what. All figures follow the filter at the top.
How it works
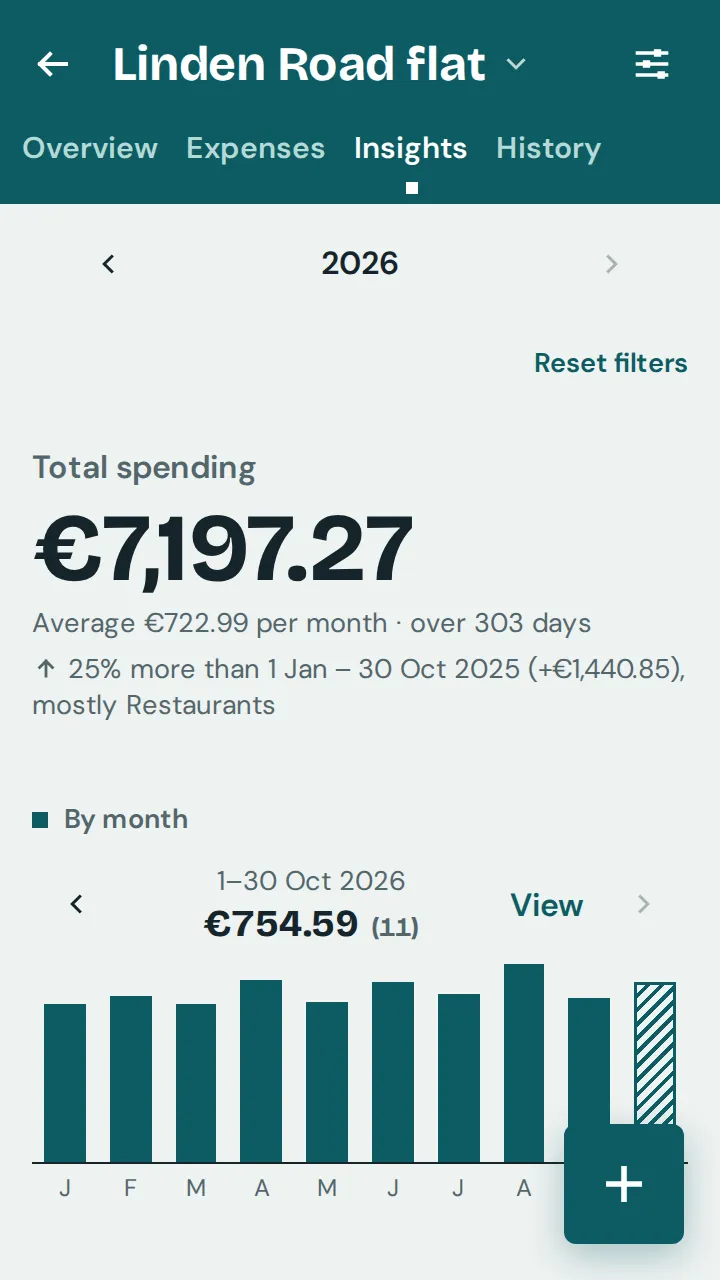
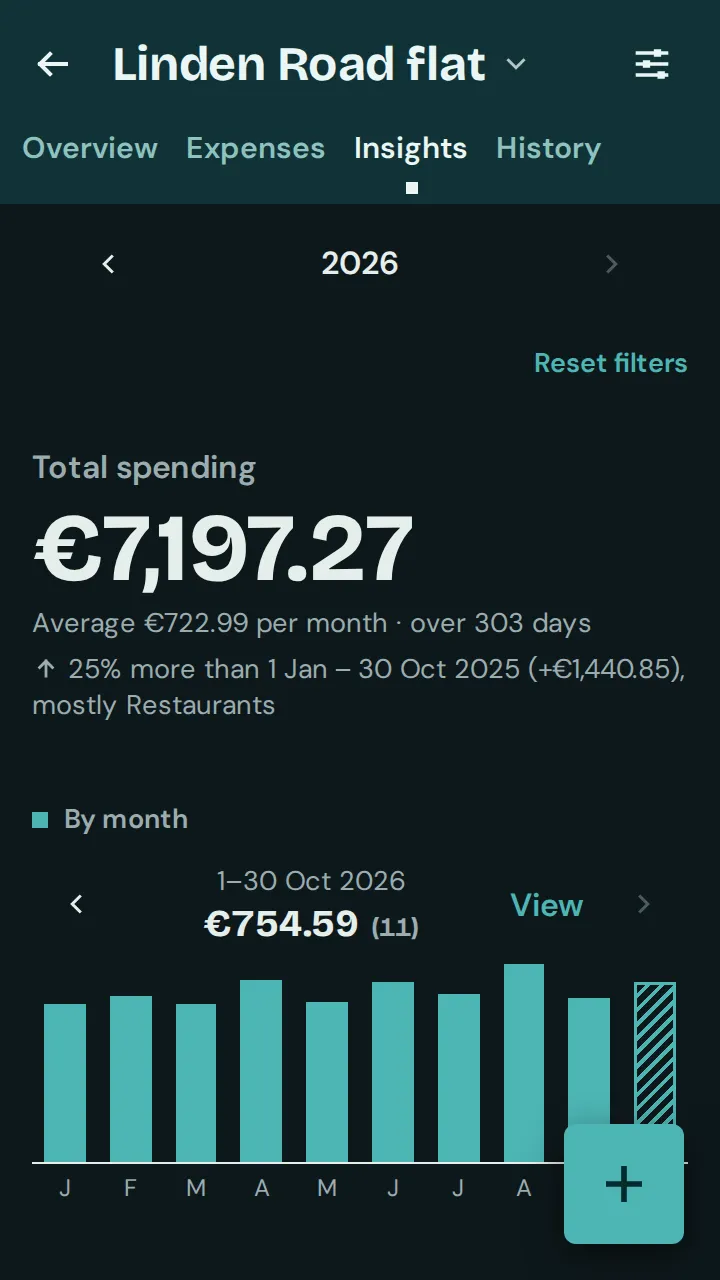
Open the group and the “Insights” tab. At the top is “Total spending”, below it the average per day, or per month for long periods, and how many days it was worked out over.
Tap “Filters” and under “Period” choose, for example, “This month” or “This year”. Use ‹ and › to move to the month or year before or after. A line below the amount compares with the period before and names the category that makes most of the difference.
Under “By month” there is a bar for each month, for each year over long periods and for each week within a month. Tap a bar to see its amount; “View” shows the whole tab for that month or year.
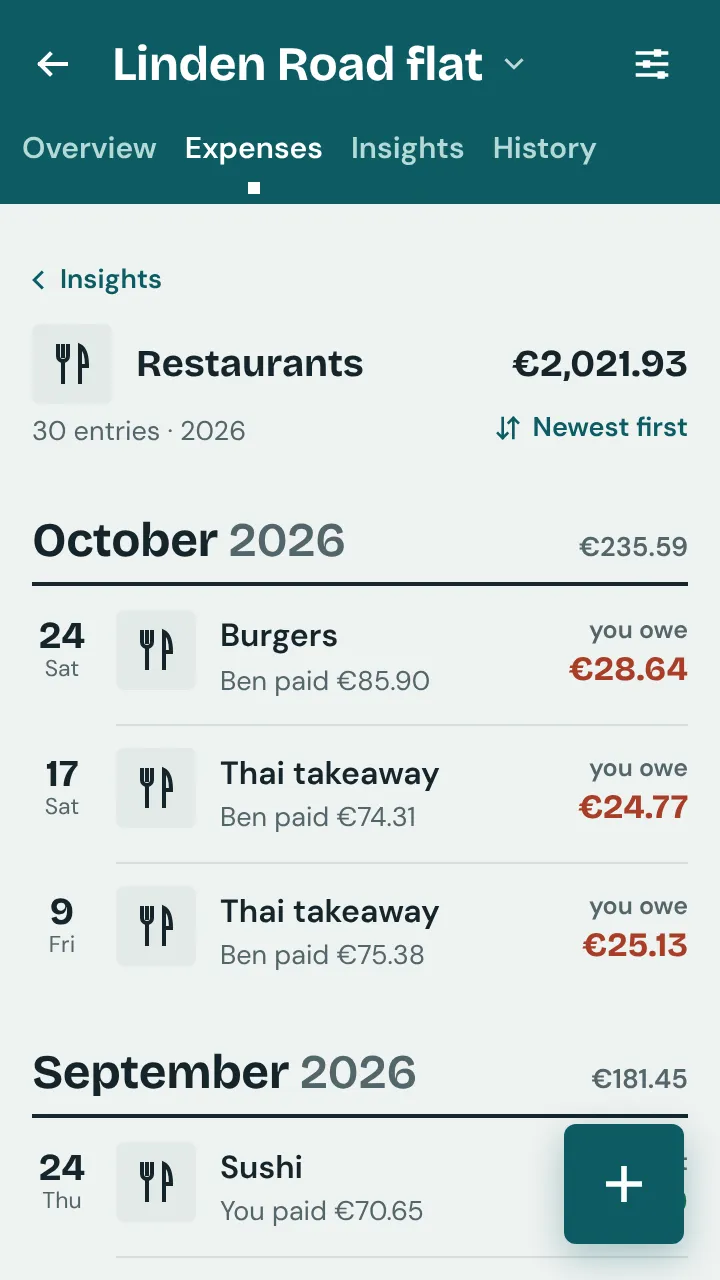
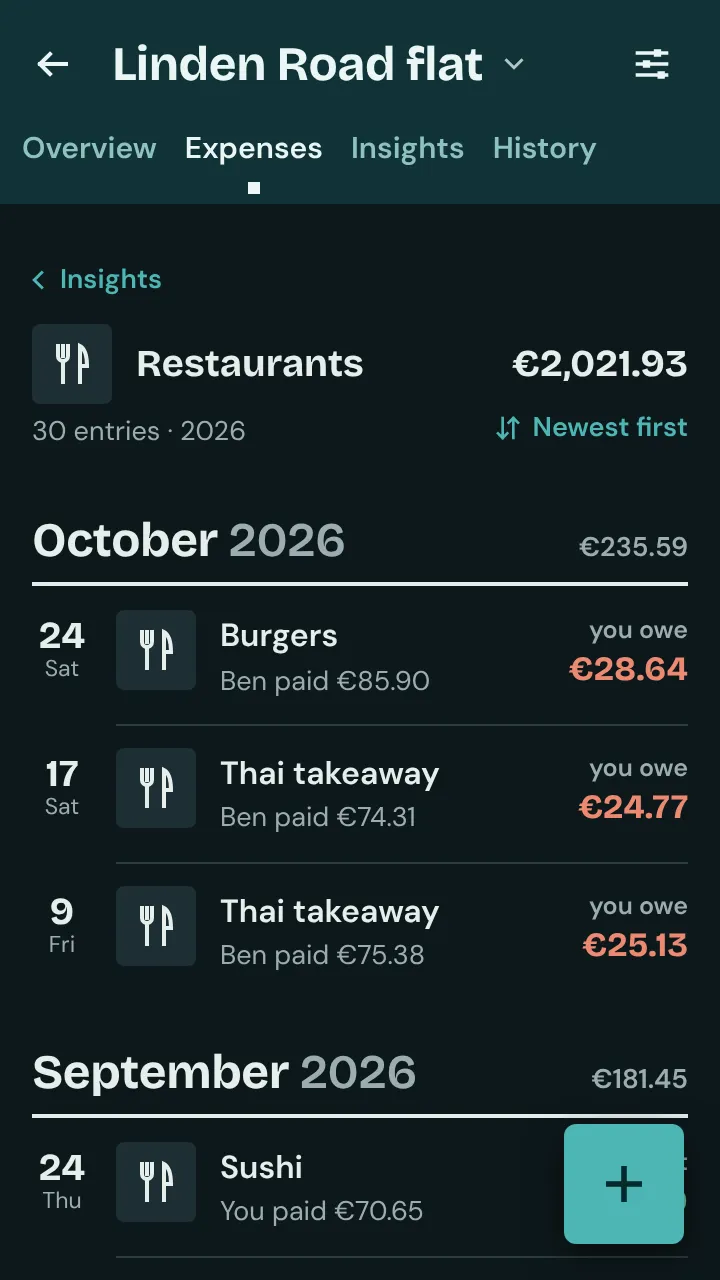
Under “By category” and “By label”, each row shows the amount with the number of entries in brackets; categories also show their share of the total at the top. Tap a row to see its entries; “‹ Insights” takes you back to the same place. Tap “Newest first” above the list to switch to “Largest first” and find large amounts quickly; this also works in the “Expenses” tab.
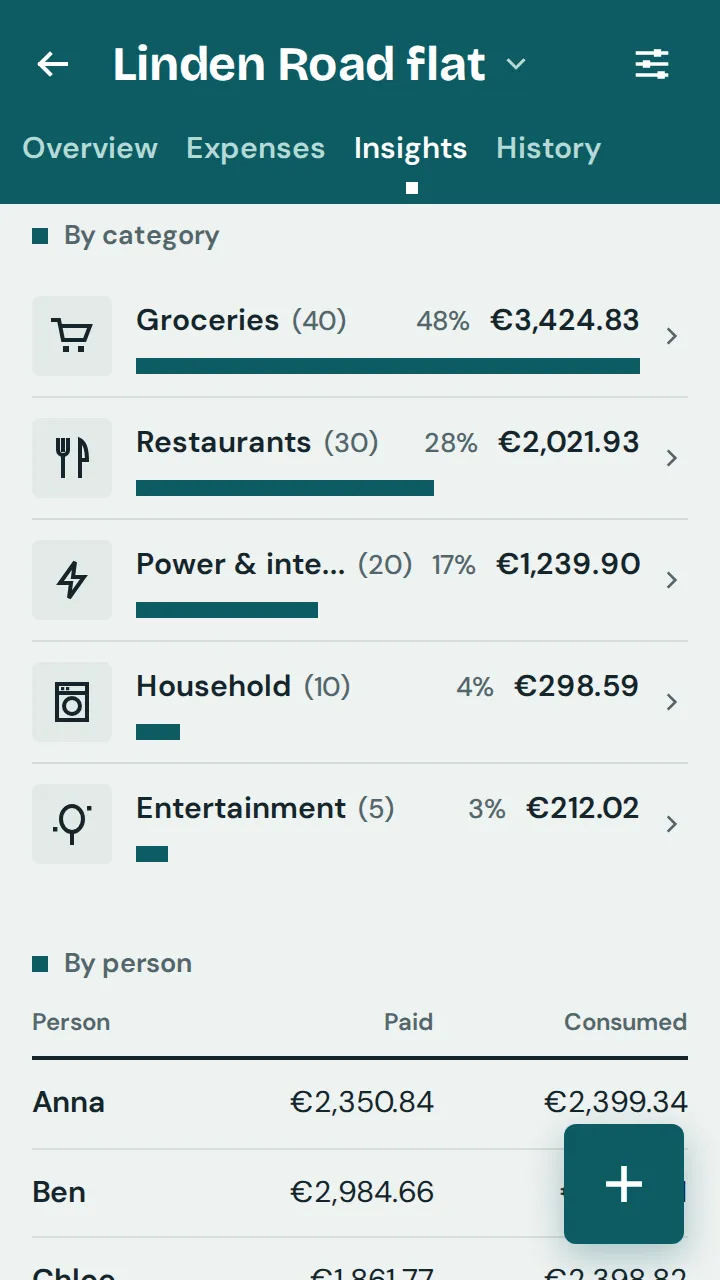
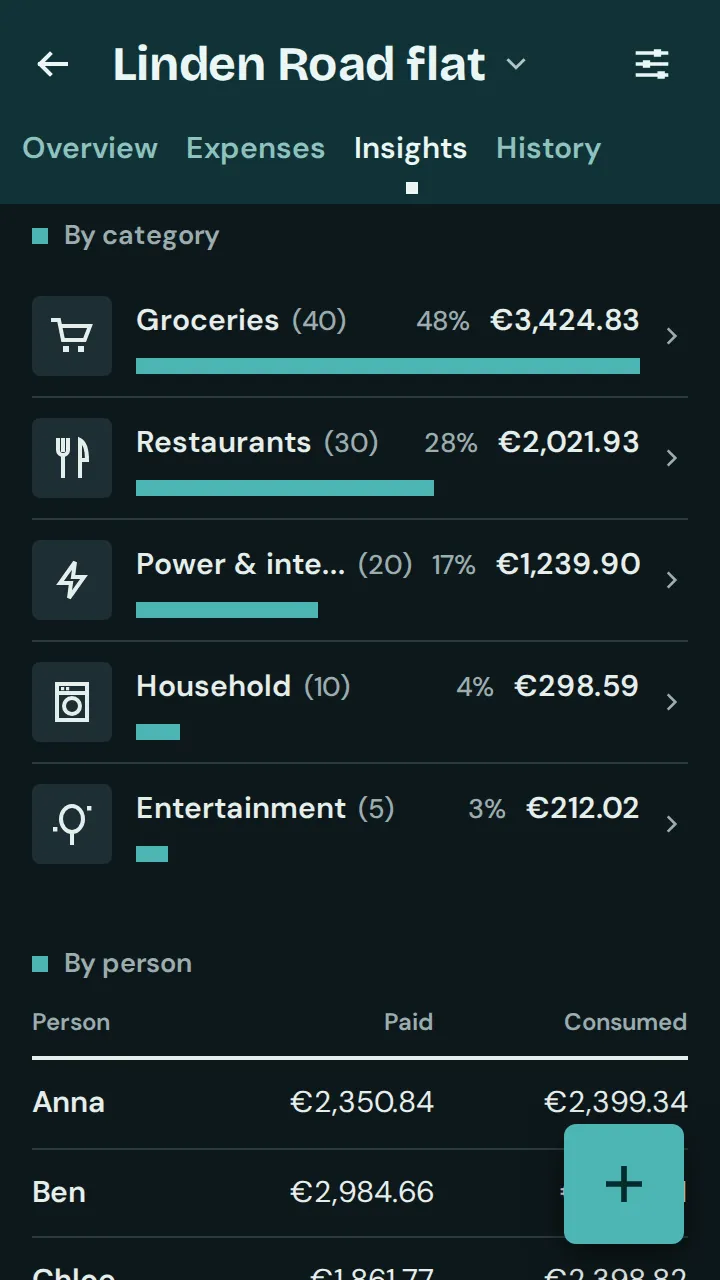
Tap “Only me” or a name at the top to see only that person’s share. The box at the end of each bar then shows their share of all expenses in the row; the key above the list explains both percentages.